Ready to dive into daily trading? A demat account for daily trading is essential. Learn how to open, use, and optimize your demat account for successful intrada
Ready to dive into daily trading? A demat account for daily trading is essential. Learn how to open, use, and optimize your demat account for successful intraday trades. Start your journey today!
Demat Account for Daily Trading: Your Gateway to Intraday Profits
Understanding the Basics: What is a Demat Account?
In the Indian financial landscape, a Dematerialized Account, or Demat Account, is indispensable for participating in the equity markets. Imagine it as a digital locker where you store your shares and other securities in electronic form. Before the advent of Demat accounts, trading involved physical share certificates, a cumbersome and time-consuming process prone to delays and potential forgery. Thanks to the Depository Act of 1996, Demat accounts revolutionized the Indian stock market, making trading faster, more efficient, and significantly safer.
Two central depositories in India, NSDL (National Securities Depository Limited) and CDSL (Central Depository Services Limited), facilitate the dematerialization and holding of securities. When you buy shares, they are credited to your Demat account; when you sell, they are debited. This process occurs seamlessly and electronically through your Depository Participant (DP), which is usually your broker (e.g., Zerodha, Angel One, ICICI Direct, etc.). SEBI (Securities and Exchange Board of India) regulates both the depositories and DPs, ensuring transparency and investor protection.
Why a Demat Account is Crucial for Daily Trading
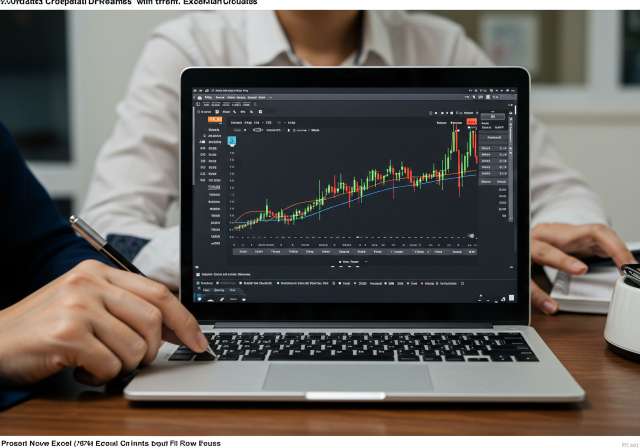
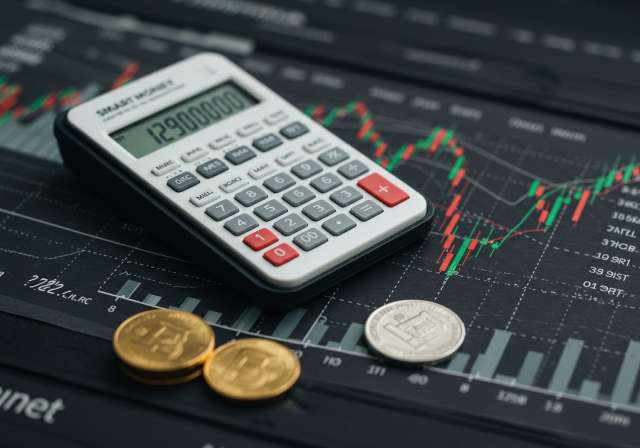
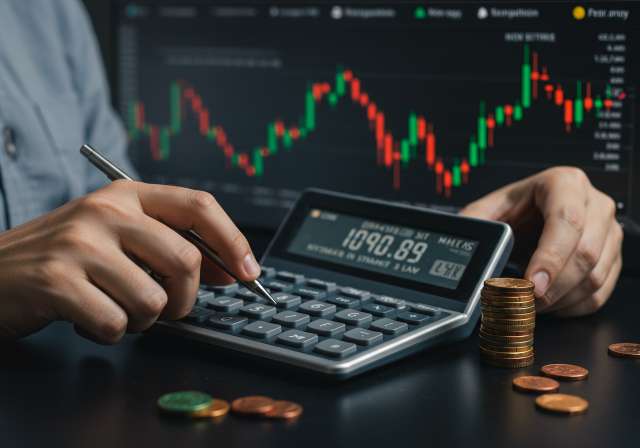
Daily trading, also known as intraday trading, involves buying and selling stocks on the same day to profit from intraday price movements. Given the fast-paced nature of this style of trading, a Demat account is not just helpful; it’s absolutely essential. Here’s why:
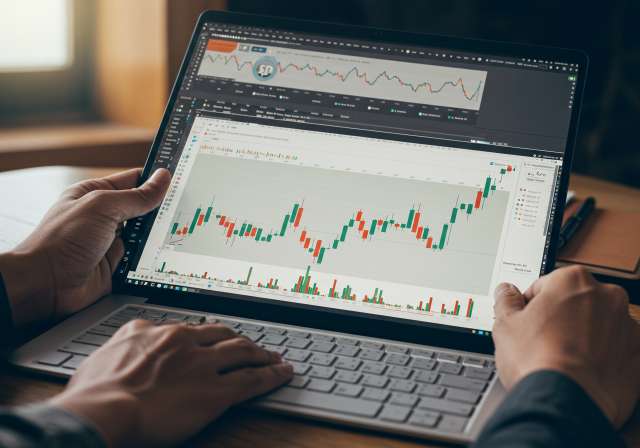
- Speed and Efficiency: Daily traders need to execute trades quickly to capitalize on short-term price fluctuations. Demat accounts enable instant transfer of shares, allowing for swift entry and exit from positions. Physical share certificates would make intraday trading practically impossible.
- Seamless Transactions: The electronic nature of Demat accounts facilitates seamless transactions. You can buy and sell shares with a few clicks through your broker’s trading platform, which is directly linked to your Demat account.
- Reduced Risk: Holding shares in physical form carries the risk of loss, theft, or damage. A Demat account eliminates these risks, ensuring the safety and security of your investments.
- Accessibility: With a Demat account, you can trade from anywhere with an internet connection. This flexibility is crucial for daily traders who need to monitor the market and react quickly to changing conditions.
- Compliance: SEBI mandates that all transactions in the equity markets be conducted through Demat accounts. Therefore, if you want to participate in daily trading, you must have a Demat account.
Opening a Demat Account: A Step-by-Step Guide
Opening a Demat account is a straightforward process. Here’s a step-by-step guide:
- Choose a Depository Participant (DP): Select a reputable broker or financial institution that acts as a DP. Consider factors such as brokerage charges, trading platform features, customer service, and research capabilities. Many brokers offer both Demat and trading accounts in a single package.
- Fill out the Account Opening Form: You can usually download the account opening form from the DP’s website or obtain it from their branch. Provide accurate personal details, including your name, address, PAN card number, and bank account information.
- Submit KYC Documents: You’ll need to submit Know Your Customer (KYC) documents, including proof of identity (e.g., Aadhaar card, PAN card, passport) and proof of address (e.g., Aadhaar card, utility bill, bank statement).
- In-Person Verification (IPV): SEBI regulations require an In-Person Verification (IPV) to verify your identity. This can be done either physically at the DP’s branch or through a video call.
- Sign the Agreement: Review and sign the agreement with the DP, which outlines the terms and conditions of the Demat account.
- Account Activation: Once your application is processed and verified, your Demat account will be activated. You’ll receive your account number and login credentials to access the trading platform.
Choosing the Right Demat Account for Daily Trading
Not all Demat accounts are created equal. When choosing a Demat account for daily trading, consider the following factors:
- Brokerage Charges: Daily traders execute a large number of trades, so brokerage charges can significantly impact profitability. Look for brokers that offer competitive brokerage rates, such as flat-fee brokerage or discount brokerage.
- Trading Platform: The trading platform should be user-friendly, reliable, and equipped with advanced charting tools and technical indicators. A robust trading platform can help you analyze market trends and execute trades efficiently.
- Margin Availability: Daily traders often rely on margin to leverage their positions. Choose a broker that offers adequate margin and competitive interest rates on margin funding. Be aware of the risks associated with margin trading, as it can amplify both gains and losses.
- Research and Analysis: Access to research reports, market news, and expert analysis can provide valuable insights for daily trading decisions. Some brokers offer comprehensive research services to their clients.
- Customer Support: Reliable customer support is essential for resolving any issues or queries that may arise during trading. Choose a broker that offers prompt and efficient customer support through multiple channels, such as phone, email, and live chat.
- Account Maintenance Charges: Check the account maintenance charges (AMC) associated with the Demat account. Some brokers offer zero AMC accounts, while others charge a fee on a quarterly or annual basis.
Optimizing Your Demat Account for Daily Trading
Once you have a Demat account, here are some tips to optimize it for daily trading:
- Link Your Demat Account to Your Trading Account: Ensure that your Demat account is seamlessly linked to your trading account. This will allow you to buy and sell shares directly from your trading platform without any delays.
- Maintain Sufficient Funds in Your Trading Account: Keep sufficient funds in your trading account to cover your trading activities. This will prevent order rejections due to insufficient funds.
- Monitor Your Account Regularly: Regularly monitor your Demat account and trading account statements to track your transactions and ensure that there are no unauthorized activities.
- Use Stop-Loss Orders: Always use stop-loss orders to limit your potential losses. A stop-loss order is an instruction to your broker to automatically sell a stock if it falls below a certain price.
- Diversify Your Portfolio: While daily trading often focuses on a few select stocks, it’s still important to diversify your overall investment portfolio. Consider investing in a mix of asset classes, such as equity mutual funds, debt funds, and gold.
Tax Implications of Daily Trading
Profits from daily trading are treated as speculative business income and are subject to income tax as per your applicable tax slab. It’s crucial to maintain accurate records of your trading transactions and consult with a tax advisor to understand your tax obligations. You can offset losses from speculative business income against profits from other speculative businesses. You’ll need to file your Income Tax Return (ITR) using the appropriate ITR form, typically ITR-3.
Alternative Investment Options for Daily Traders
While a Demat account primarily facilitates equity trading, consider exploring other investment avenues as well to diversify your portfolio and manage risk:
- Equity Mutual Funds: Consider investing in equity mutual funds, particularly those focused on large-cap or index funds. These funds offer diversification and professional management. SIPs (Systematic Investment Plans) are a convenient way to invest regularly in mutual funds.
- ELSS (Equity Linked Savings Scheme): ELSS funds offer tax benefits under Section 80C of the Income Tax Act, 1961, along with equity market exposure. They have a lock-in period of three years.
- PPF (Public Provident Fund): PPF is a long-term savings scheme that offers tax benefits and guaranteed returns. It’s a good option for building a retirement corpus.
- NPS (National Pension System): NPS is a government-sponsored pension scheme that allows you to save for retirement and avail tax benefits.
- Debt Funds: Invest in debt funds to add stability to your portfolio. Debt funds invest in fixed-income securities, such as government bonds and corporate bonds.
Conclusion
A Demat account is the cornerstone of daily trading in the Indian stock market. By understanding how to open, use, and optimize your Demat account, you can significantly enhance your chances of success in intraday trading. Remember to choose a reputable broker, maintain sufficient funds in your trading account, use stop-loss orders, and diversify your portfolio. Stay informed about market trends and seek professional advice when needed. Daily trading involves risk, but with careful planning and execution, it can be a rewarding experience.